Assembly Call Stack Lab
Goals
Your primary goal for this lab is to get familiar with using the GNU debugger (gdb) to explore and debug x86-64 programs, in which you may not be able to view the original C source. As a secondary goal, you’ll get some practice that may help with any sneaky escapades you may undertake.
Documentation and tutorials
You will find some potentially useful gdb resources posted on our Resources page.
Getting started
In this lab, we’ll be working with a pre-compiled program named call_proc. Grab the program and what source code I’m giving you, and copy them to mantis.
Here are some steps to follow:
-
SSH into
mantisviafernand open a terminal in yourCS208folder. -
Make a new directory for this lab:
mkdir asm-stack-lab -
Change to your new directory:
cd asm-stack-lab -
Grab the compiled program and source code:
wget https://cs.carleton.edu/faculty/tamert/courses/cs208-s25/resources/samples/call_proc.tar -
Un-tar it:
tar xvf call_proc.tar -
Look at the source code in
call_proc.c. You should see theprocfunction, and some other stuff we’ll explore soon. -
You won’t be able to compile the program yourself, as you don’t have a definition for the function
phase_0. You do have the executable, however. Try to runcall_proc. Unless you get really lucky, you won’t win. :)./call_procNote: If you have any issues running call_proc, you can use the following command to make it executable:
chmod +x call_proc
Step 1: Exploring proc with gdb
We’ll now explore the proc function.
-
Open the file
call_proc.c. You’ll find this function on lines 31–41. -
Run
gdb, ready to step throughcall_proc:gdb call_proc
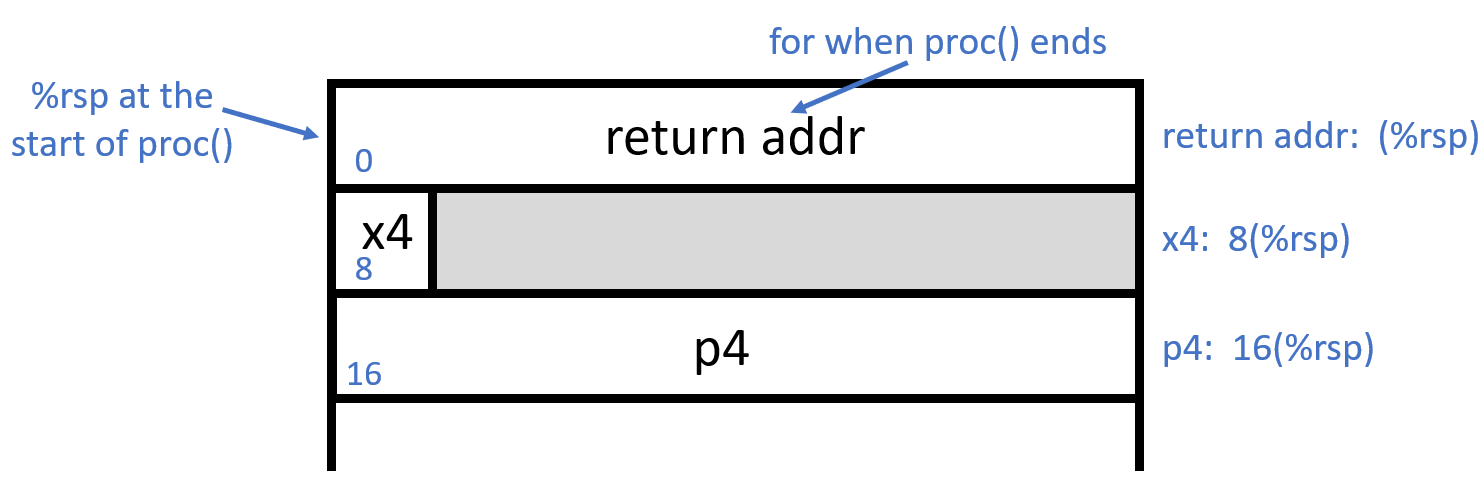
We want to explore the inputs to proc (of which there are many). We expect to find the first six arguments in registers, with arguments 7 and 8 (x4 and p4, respectively) instead on the stack (because this is what happens if more than 6 parameters are passed to a function). In this case, proc is called on line 38, as follows:
```c
proc(10, &a, 20, &b, 30, &c, 40, &d);
``` The following picture represents the state of the stack at the start of a call to `proc`:
Let’s find the arguments!
-
We’re using
gdb, so set a breakpoint at the start ofproc:(gdb) b proc - Run the
call_procprogram:(gdb) r - You’ll have to enter a number, and then you should hit the breakpoint. We expect the first argument in register
%rdi; we should find the value10there:(gdb) print $rdi(Note the very silly convention in
gdbthat you use$for registers instead of%.) - The next argument should be in register
%rsi. This one is an address, and we don’t have a good sense of what the address is yet. We’ll explore that later, in Step 2:(gdb) print $rsi -
By default, the above displays in decimal, which is kind of useless for addresses. Use
/xto make it display in hex instead:(gdb) print /x $rsi -
Arguments 3–6 should be in registers
%rdx,%rcx,%r8, and%r9, respectively. It’s tedious to view each individually, so let’s look at all registers instead:(gdb) i r -
You’ll likely notice that the contents of
%rdxand%r8don’t look like what we expect. Keep in mind that they’re in hex, not decimal! Conveniently, usingi rin gdb displays both, one per column. Make sure you know which one you’re reading. -
Now let’s look at the stack to find our 7th and 8th arguments (when I ran this,
%rspcontained the value0x7fffffffe458):(gdb) x/3gx 0x7fffffffe458 #change to what %rsp contains for youThe first 64 bits (a “giant” word in
gdb, hence theg) contain the return address for whenprocis done. The next 8 bytes are our 7th parameter (0x28 in hex is 2*16+8 = 40 in decimal), followed by an address that is our 8th parameter. -
If you type
list, you’ll see the C code for theprocfunction:(gdb) list -
If instead you want to see the assembly, you can type
layout asm. This gives us a split screen with the assembly code on the top and the(gdb)command prompt on the bottom. Note that it can be a bit erratic, so if it gets messed up visually, press the key combinationCtrl-Lto redraw the screen.(gdb) layout asm -
Read through the resulting assembly (it’s just seven lines) and make sure you can follow what it’s doing.
- Next, we’ll look at a function that calls
proc; this function is aptly namedcall_proc.
Step 2: Exploring call_proc with gdb
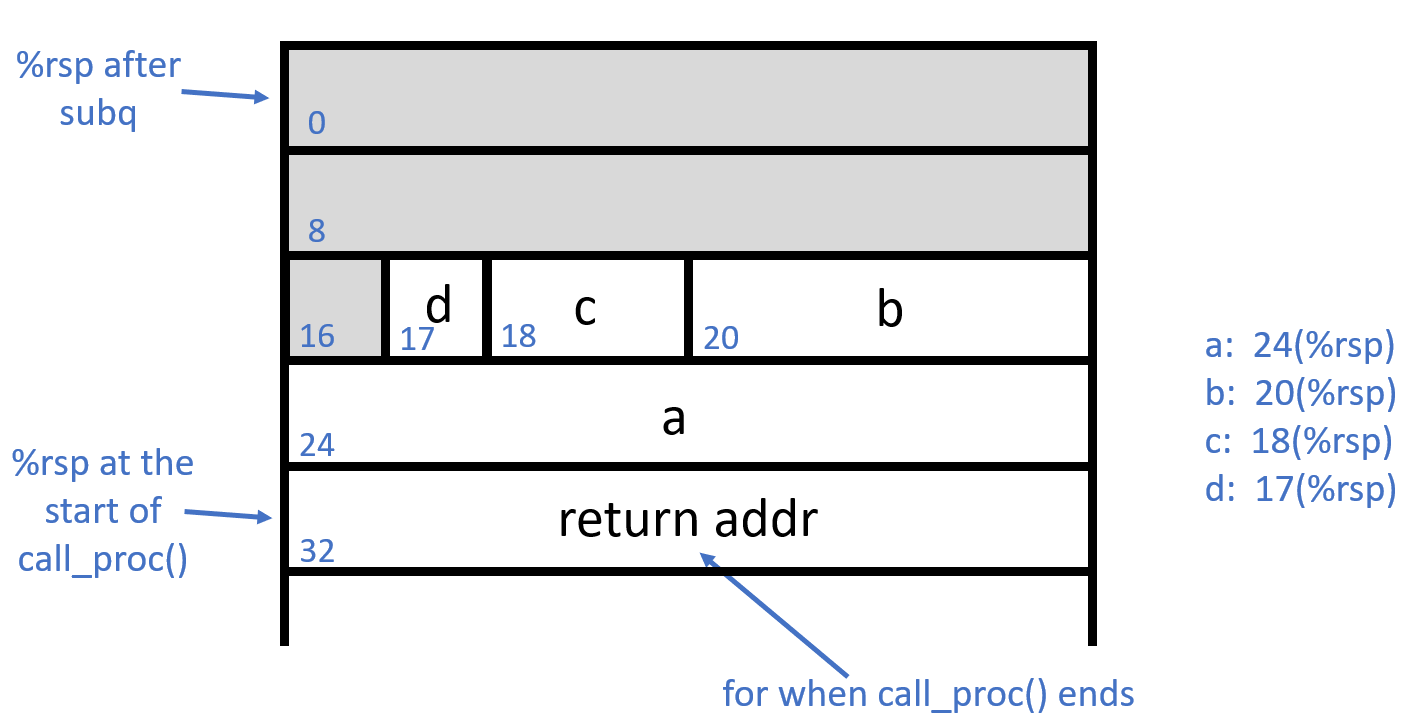
We’re going to step through call_proc to see how well it lines up with our understanding of its use of local variables and argument prep on the stack. We’re assuming the stack will look like this after the four local variables are given their values:
-
If you’re continuing from Step #1, type
cto continue the program (this should complete its execution), then typedto delete all breakpoints. If you’re starting fresh, rungdb call_proc. -
Set a breakpoint in the function
call_proc:(gdb) b call_proc - Run the program, and enter a number:
(gdb) r Guess a number: 123 -
This should hit the breakpoint. We expect
ato be stored in24(%rsp). The first thing you should notice is that this isn’t the case. Where is it storing$0x1instead? -
Draw a picture for yourself that shows the state of the stack now that we’ve seen the actual assembly.
-
Let’s move down to check the stack. Type
nifor next instruction, and repeat it several times until you’re about to execute the firstleainstruction. -
Inspect the stack. Let’s look at the 32 bytes starting at the top of the stack:
(gdb) x/32bx $rsp -
Somewhere in the output block, you should see
0x01followed by 70x00d. That’sa. On the line above, you’ll see each ofb(4 bytes),c(2 bytes), andd(1 byte), all next to each other. -
Let’s keep going, and see the argument building to prep for calling
proc. Notice theleainstructions; for example, address0x10(%rsp)(that’sa) is put in%rsi, as&ais provided as our second argument on line 23 of the source code. Additionally, we see that%raxand$0x28(that’s 40 in hex) are pushed to the stack; these are arguments 8 and 7, in that order. - Finally, let’s print out the state of the stack right before the
callqto jump toprocexecutes. Hit return several more times (and/or typeniagain) to get there, let’s look at the stack:(gdb) x/48bx $rsp - The stack should approximately match this state of the world:
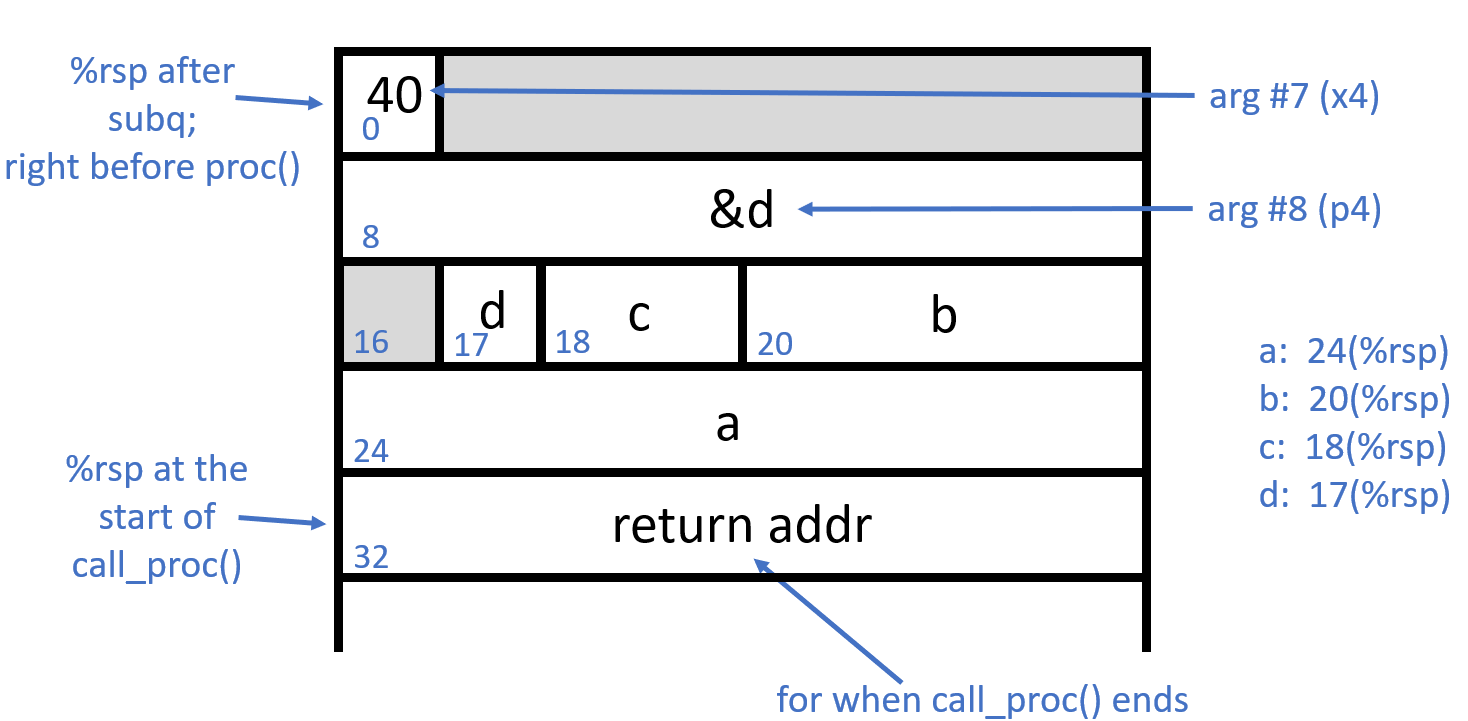
(There are some extra push instructions up above, so we have some saved registers, too, but this should be close.)
Step 3: What is phase_0?
Let’s figure out phase_0!
-
Looking at the assembly itself can be helpful. Get the assembly with:
objdump -d call_proc > call_proc.asmThen open up
call_proc.asmand look through it a bit for the overall structure -
Another helpful tool is
strings. This tool can tell you the location of every string in a program with-t(and you need to tell it what base you want the info in,xfor hex):strings -t x call_proc > call_proc_strings.txtTake a look at the resulting file and find the location for “Guess a number: “. Compare that to your
call_proc.asm. You should see a line:1357: 48 8d 35 b9 0c 00 00 lea 0xcb9(%rip),%rsi # 2017 <_IO_stdin_used+0x17>This is telling you that
0xcb9(%rip)is pointing at that string. -
Let’s look at
phase_0in the assembly. Search in the file for the section labeledphase_0. You can see thatphase_0is doing something withsscanf, which grabs out chunks of a string based on the format string (and you should read up about it and its man page). Make notes to yourself in the assembly with#on what the assembly is doing with the result of the call tosscanf. -
What argument is getting passed to
call_proc? -
What happens with the return value from
call_proc? (0x13a is 314 in decimal) Under what conditions do you get to the string “You win!”? -
With that, you should be able to reverse engineer what number you need to guess to win!
If you’ve gotten this far, feel free to work on your zoo escape with these new tools!
Extra
Get some extra practice tracing complex recursion with function_puzzle.asm