Debugging Lab
This is a lab assignment, so it isn’t required to complete. However, the concepts and practice will help you on both the homework and exams so I encourage you to make a serious effort on it during class and consider finishing it outside of class. If you do finish it and submit it to Moodle, you’ll earn an extra engagement credit.
I recommend creating a folder in COURSES for this lab as you usually do.
Exercise 1
Debugging poorly written and buggy code is a valuable skill.
To help you practice it, I’ve written a painfully bad program called bad.py (or is it??) that attempts to convert Celsius temperature to Fahrenheit.
That calculation should be (C * 9/5) + 32 where C is the value in Celsius.
Download this code, move it to your folder for today, and open it in VSCode.
This code is both badly styled, making it very difficult to read, and has a bug or two. You should aim to improve it, which will probably involve:
- Drawing out a memory reference diagram of what is going on with each of the variables
- Fixing variable names
- Getting it to output something
- Fixing a logical bug
- Making the variable names useful and rearranging things
- Writing comments and documentation
Exercise 2
Here is a another buggy program.
Scenario: You are going shopping for meat and milk, but there is tax. You buy $2.00 of milk and $4.00 of meat, and the tax rate is 3%. Print out the total cost of your groceries (you don’t need to print the dollar sign).
Steps:
- First, work out with a calculator what the price should be for $6 of food and 3% tax.
- Then, copy this code into a file and see what it gives you, then debug it.
meatPrice = 4.00
meatTax = 0.03 * meatPrice
milkPrice = 2.00
milkTax = 0.03 * milkPrice
print(meatTax + meatPrice + milkTax + meatPrice)
*Source: https://cscircles.cemc.uwaterloo.ca/1e-errors/ *
Exercise 3
More bugs! This time with this drawing program that uses a different module for drawing. Download both and put them in your folder for today. Then run compound_tree.py and see what it gives. It should be this (but it isn’t currently):
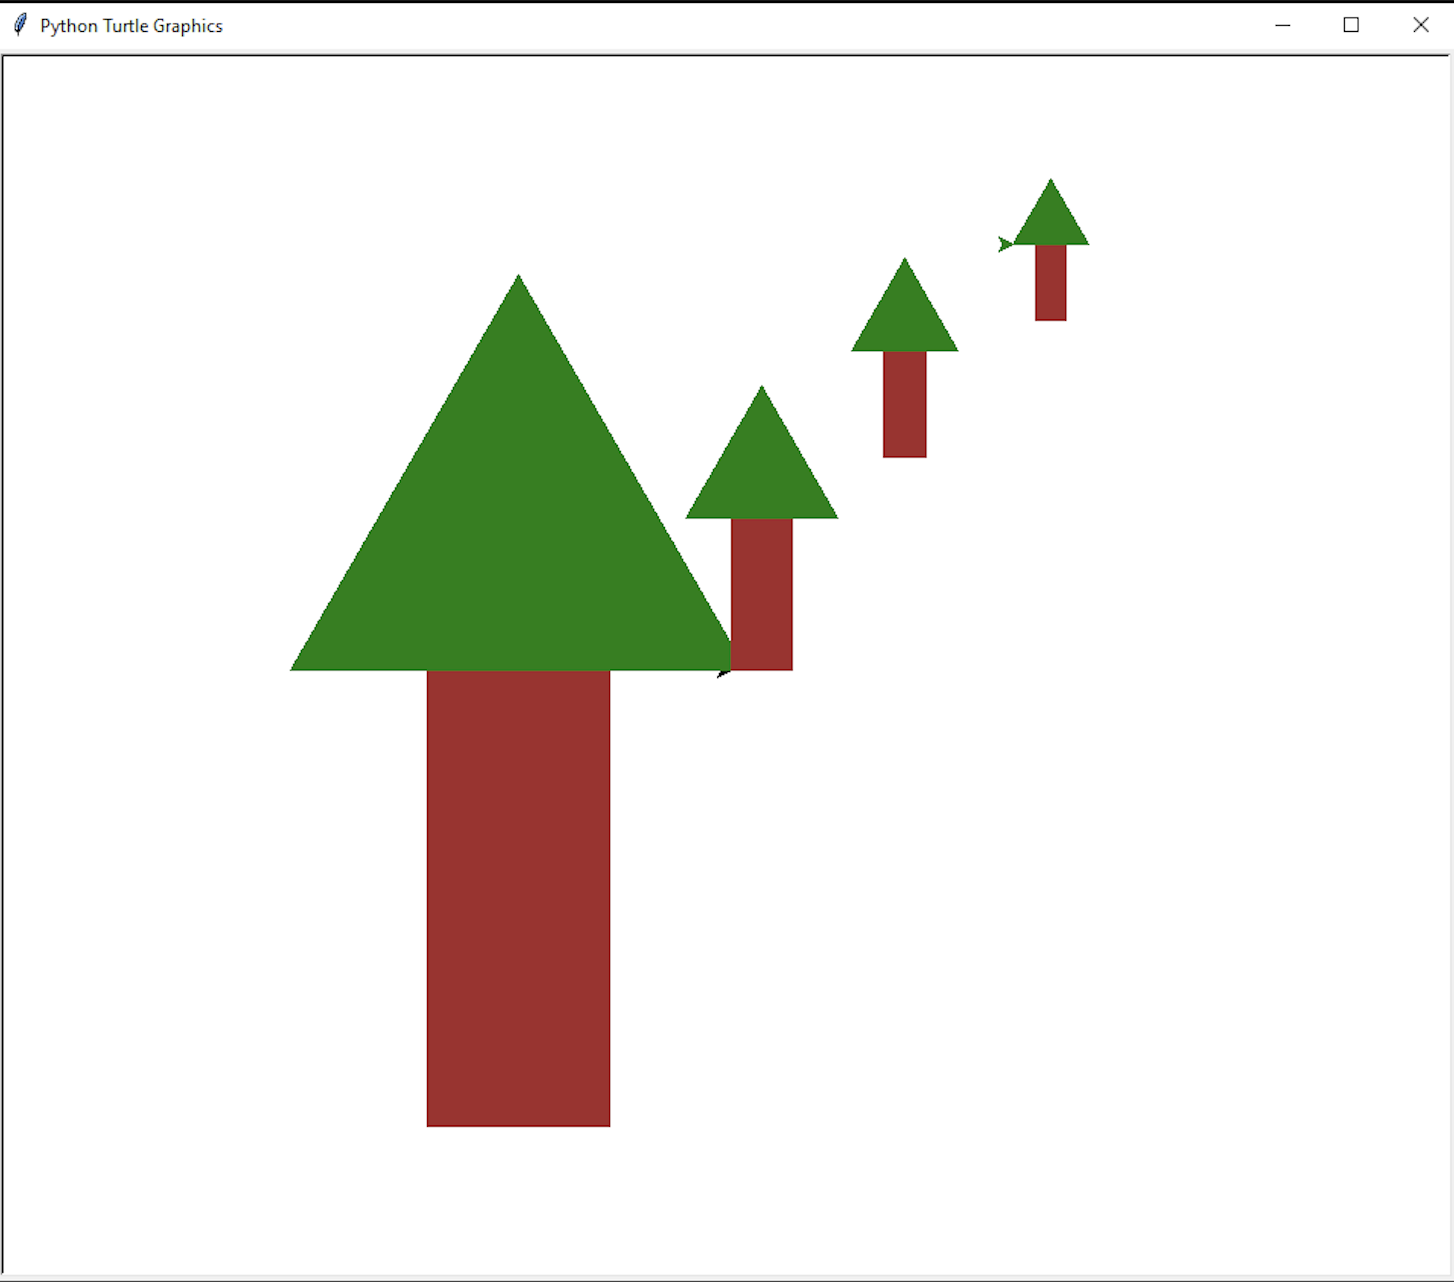
Use printing to trace through and find the bugs. There is one in each file.
Submission
Submit your fixed programs for Exercises 1-3.
Extra
Many of you are interesting in plotting data with Python, so let’s explore matplotlib a bit. Try out the following:
from matplotlib import pyplot as plt # new!

def main():
    x_vals = [1,2,3,4]
    y_vals = [1,4,9,16]

    plt.plot(x_vals, y_vals)
    plt.show()

if __name__ == "__main__": # weird but good to have
    main()
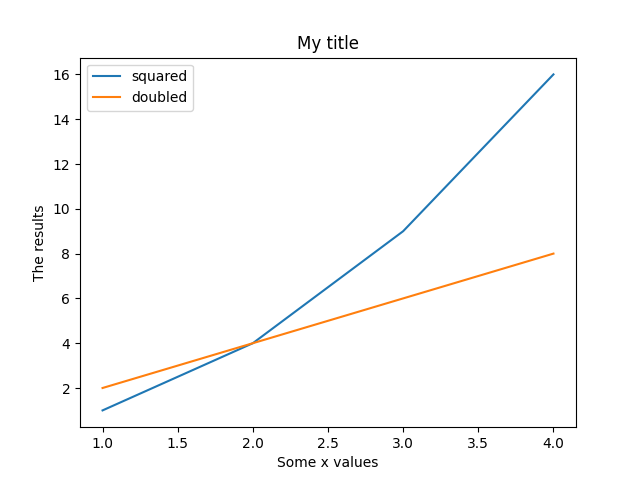
Extra 2: Customizing a graph
You can also look at Matplotlib samples to find out how to customize the plot with a title, legend, etc.
Spend a few minutes exploring until you have a legend, title, and axis labels.
Here is an example graph:
Extra 3: A different graph
How would you draw a bar graph instead of the line graph? Explore the Matplotlib samples to find a relevant code sample.